How to see Linux Memory - Swap - From Terminal
1- Introduction
In this article, We will examine the free unix command that we can easily use in the terminal. We will also refer to the top and htop commands as alternatives.
2- Free
free command is a Unix command that can provide information about the memory usage in the system in different formats. It also shows the used, unused and other reserved memory values at the current system instant, especially the physical and swap memory values.
Note: Note: When we use the free command without parameters, it will show the relevant memory values in kibibytes (kibibytes) by default.
$ free or free -k or free --kibi
volkan@Volkan:~$ free
              total        used        free      shared  buff/cache   available
Mem:       16222540     4056152     9249576      125128     2916812    11733644
Swap:       7906300           0     7906300
free or free -k or free --kibi
Let's explain what we see briefly,
- Mem: It displays the physical memory value.
- Swap: It will show the reserved value for RAM usage on the disk. When the physical memory is full, inactive pages are moved from the RAM to the swap area.
- Total: It will show the amount of memory in the system.
- Used: It will show how much memory is used in the system.
- Free: It will show how much memory is not used for any operation.
- Shared: It shows the amount of shared memory. To explain briefly, we can think of it as more than one process (process) using the same memory.
- Buff/Cache: Buffers are the amount of memory used by the kernel buffers. Cache shows the amount of memory used by page caches and slabs.
- Available: It will show the estimated amount of memory available.
2.1 - Free -h (Human-Readable) Option
Let's take a look at the command that is most commonly parametrically preferred. To see in human-readable format, in Linux terminal;
free -h or free --human
volkan@Volkan:~$ free -h
              total        used        free      shared  buff/cache   available
Mem:           15Gi        10Gi       197Mi       218Mi       4,8Gi       4,5Gi
Swap:         7,5Gi        12Mi       7,5Gi
free -h
when using free -h;
- It automatically converts the corresponding values to display the shortest (GiB, MiB, etc.).
- With the
free -h --siparameter, memory values can be displayed in decimal base.
volkan@Volkan:~$ free -h --si
              total        used        free      shared  buff/cache   available
Mem:            15G         10G        175M        223M        4,9G        4,5G
Swap:          7,7G         12M        7,7G
free -h --si
Showing in Binary and Decimal bases
We can observe the memory values in Kikibytes or Kilobytes - Mebibytes or Megabytes. The difference between them is simple;
- Kikibyte or Mebibyte is shown as a base system of 2, that is, a multiple of 2.
- Kilobytes or Megabytes are displayed on the basis of the base system of 10, that is, the value in multiples of 10.
- 1 Kilobyte (KB) is 1000 bytes, while 1 KikiByte (KiB) is 1024 bytes.
Note: Similar values continue as follows.
| Decimal | Binary Number |
|---|---|
| Kilobyte | Kikibyte |
| Megabyte | Mebibyte |
| Gigabyte | Gibibyte |
| Terabayt | Tebibyte |
| Petabyte | Pebibyte |
For example, let's sample them with 8 GB RAM values;
- Equivalent to 8096051 KiloBytes (KB) and 7906300 KibiBytes (KiB).
- Equivalent to 8096 MegaBytes (MB) and 7720 (MiB).
3 - Another Free Parameters
3.1 Displaying in KikiBytes
It can be shown by the commands of; free, free -k or free --kiki
free -k
              total        used        free      shared  buff/cache   available
Mem:       16222540    11103248      344768      208400     4774524     4577916
Swap:       7906300       32512     7873788
free or free -k or free --kiki
3.2 Free - Displaying in Kilobytes
It can be shown command of; free --kilo
free --kilo
              total        used        free      shared  buff/cache   available
Mem:       16611880    11386777      328843      210255     4896260     4673880
Swap:       8096051       33292     8062758
free --kilo
3.3 Free - Displaying in Mebibit
It can be shown command of;free -m or free --mebi
free -m
              total        used        free      shared  buff/cache   available
Mem:          15842       10825         352         209        4664        4482
Swap:          7720          31        7689
free -m or free --mebi
3.4 Free - Displaying in MegaByte
It can be shown as Megabyte (MB) by command of;free --mega
free --mega
              total        used        free      shared  buff/cache   available
Mem:          16611       11347         374         218        4890        4705
Swap:          8096          33        8062
free --mega
All other options can be used as follows;
free [options]
 -b, --bytes         show output in bytes
     --kilo          show output in kilobytes
     --mega          show output in megabytes
     --giga          show output in gigabytes
     --tera          show output in terabytes
     --peta          show output in petabytes
 -k, --kibi          show output in kibibytes
 -m, --mebi          show output in mebibytes
 -g, --gibi          show output in gibibytes
     --tebi          show output in tebibytes
     --pebi          show output in pebibytes
3.5 - Monitoring Memory Values - Interval
By using free -s {Seconds}, the {Seconds} field is the seconds' parameter and the numeric value must be entered. It will repeat printing every N seconds.
For example; To see memory values in mebibytes every 3 seconds;
free -m -s 3
              total        used        free      shared  buff/cache   available
Mem:          15842        5718        6208         221        3915        9584
Swap:          7720           0        7720

              total        used        free      shared  buff/cache   available
Mem:          15842        5835        6038         273        3968        9414
Swap:          7720           0        7720

              total        used        free      shared  buff/cache   available
Mem:          15842        6016        5794         322        4031        9184
Swap:          7720           0        7720

[5]+  Stopped                 free -m -s 3
free -m -s 3
Note: It will continue to show every 3 seconds unless the process is killed.
3.6 - Specifying How Many Times to Display Memory Values
By using free -c {Count}, It will repeat printing N times, then stop.
As an example, By using free -m -c 2 command. Let's want to show the memory values in mebibytes two times.
free -m -c 2
              total        used        free      shared  buff/cache   available
Mem:          15842        5485        6460         181        3896        9857
Swap:          7720           0        7720

              total        used        free      shared  buff/cache   available
Mem:          15842        5485        6460         181        3896        9857
Swap:          7720           0        7720
free -m -c 2
3.7 - To Monitor Memory Values in Interval and in a Certain Repeat
free -s {Seconds} -c {Count}
For example;
By using free -h -s 5 -c 3 to display the memory values in human-readable format 3 times every 5 seconds.
free -h -s 5 -c 3
              total        used        free      shared  buff/cache   available
Mem:           15Gi       5,4Gi       6,3Gi       181Mi       3,8Gi       9,6Gi
Swap:         7,5Gi          0B       7,5Gi

              total        used        free      shared  buff/cache   available
Mem:           15Gi       5,7Gi       5,8Gi       344Mi       4,0Gi       9,1Gi
Swap:         7,5Gi          0B       7,5Gi

              total        used        free      shared  buff/cache   available
Mem:           15Gi       6,1Gi       5,3Gi       458Mi       4,1Gi       8,6Gi
Swap:         7,5Gi          0B       7,5Gi
free -h -s 5 -c 3
3.8 - Showing Buff and Cache Values Separately
free -w or free --wide command shows buffers and cache separately.
free -h command combined with buff/cache.
              total        used        free      shared  buff/cache   available
Mem:           15Gi       6,0Gi       5,5Gi       213Mi       4,0Gi       9,0Gi
Swap:         7,5Gi          0B       7,5Gi
free -h
By using free -h -w command, buffers and cache values are displayed separately.
free -h -w
              total        used        free      shared     buffers       cache   available
Mem:           15Gi       6,0Gi       5,5Gi       211Mi       434Mi       3,6Gi       9,0Gi
Swap:         7,5Gi          0B       7,5Gi
free -h -w or free -hw
3.9 - Seeing Physical and Swap Values Together
free -tcommand shows the total memory amounts.
Let's examine the total amount of memory with the free -t -h command with the human readable option;
free -t -h
              total        used        free      shared  buff/cache   available
Mem:           15Gi       5,1Gi       6,1Gi       156Mi       4,2Gi       9,9Gi
Swap:         7,5Gi          0B       7,5Gi
Total:         23Gi       5,1Gi        13Gi
free -t -h or free -th
3.10 - Other Uses with Free --help
By using free --help command, explanations of all free command usages can be viewed.
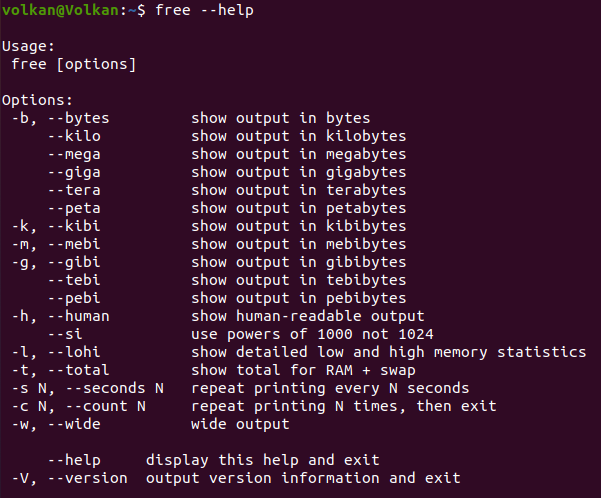
Other Alternative Commands
1- Top
By using top command, memory values can be observed as in the free command. In addition, it is possible to see how much resources the CPU and which process consumes.
- We can see that the relevant values are displayed in Mebibytes.
- "SHIFT + M" can be used to sort related processes by %MEM value.
- It is also possible to see information about running processes and CPU values.
2- Htop
htop command is a much more advanced tool than the top command.
Notes:
- It may be necessary to install this tool.
- Relevant values are represented as bytes values.
- Mouse "click" controls can be used (Sorting, selecting, etc.)
- SHIFT + M can be used to sort related processes by %MEM value
- We can also see the Running Processes and CPU values.
- Sorting can be done by pressing F6 and Sorted By options.
3 - Meminfo
By using cat /proc/meminfo command, all memory values can be viewed
cat /proc/meminfo
MemTotal:       16222540 kB
MemFree:         6328656 kB
MemAvailable:   10317004 kB
Buffers:          501160 kB
Cached:          3771164 kB
SwapCached:            0 kB
Active:          1858928 kB
Inactive:        7222992 kB
Active(anon):      41724 kB
Inactive(anon):  4924252 kB
Active(file):    1817204 kB
Inactive(file):  2298740 kB
Unevictable:        8164 kB
Mlocked:              16 kB
SwapTotal:       7906300 kB
SwapFree:        7906300 kB
Dirty:              1172 kB
Writeback:             0 kB
AnonPages:       4817856 kB
Mapped:           899656 kB
Shmem:            164068 kB
KReclaimable:     209384 kB
Slab:             415968 kB
SReclaimable:     209384 kB
SUnreclaim:       206584 kB
KernelStack:       24256 kB
PageTables:        63524 kB
NFS_Unstable:          0 kB
Bounce:                0 kB
WritebackTmp:          0 kB
CommitLimit:    16017568 kB
Committed_AS:   19245960 kB
VmallocTotal:   34359738367 kB
VmallocUsed:       93812 kB
VmallocChunk:          0 kB
Percpu:             8480 kB
HardwareCorrupted:     0 kB
AnonHugePages:         0 kB
ShmemHugePages:        0 kB
ShmemPmdMapped:        0 kB
FileHugePages:         0 kB
FilePmdMapped:         0 kB
HugePages_Total:       0
HugePages_Free:        0
HugePages_Rsvd:        0
HugePages_Surp:        0
Hugepagesize:       2048 kB
Hugetlb:               0 kB
DirectMap4k:      694192 kB
DirectMap2M:    13819904 kB
DirectMap1G:     2097152 kB
Conclusion
We have seen how we can observe the memory values from the Linux terminal. We mentioned free, top and htop which are the most used commands in the Linux. We also saw where these values were monitored by accessing the Meminfo file.